Background
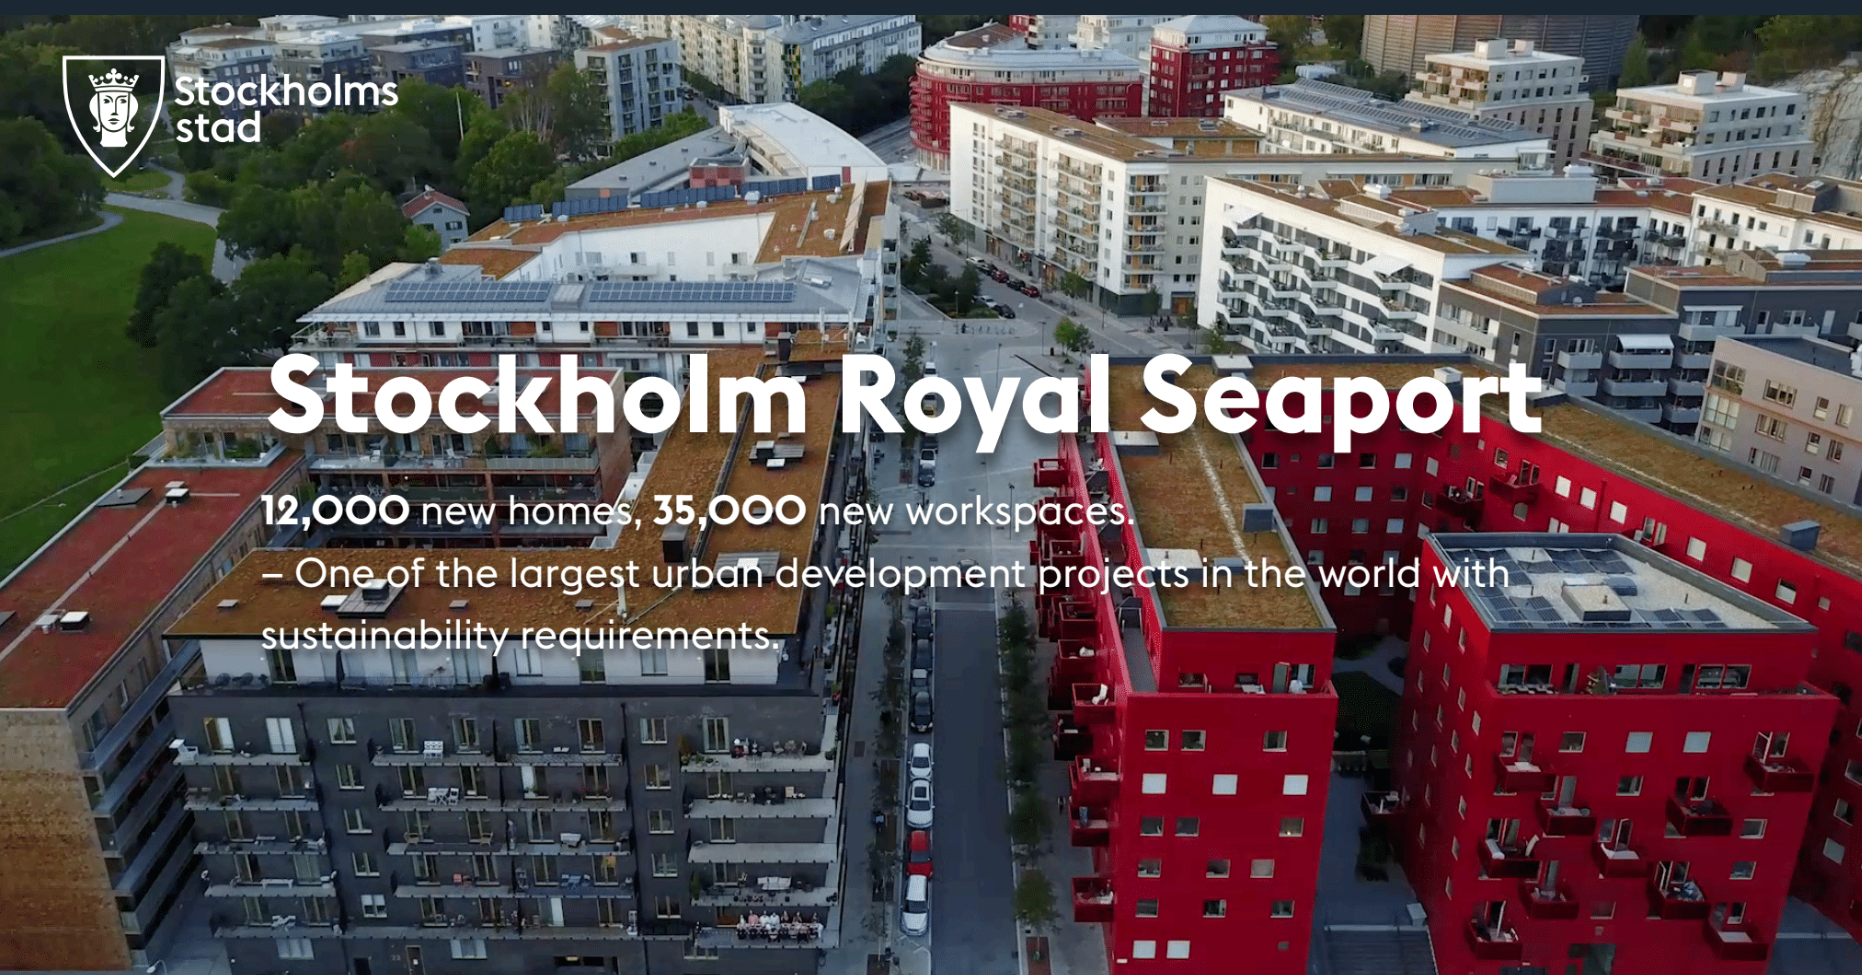
Stockholm Royal Seaport Program is decided and designated by Municipal Council to create effective urban environments through advanced sustainability efforts. The program aims to develop on the basis of high ambition for sustainable urban planning from a number of different targets like CO2 emission rate, energy use etc. These targets are made concrete and clarified in the requirements for each phase and are monitored throughout the entire process.
Our Project
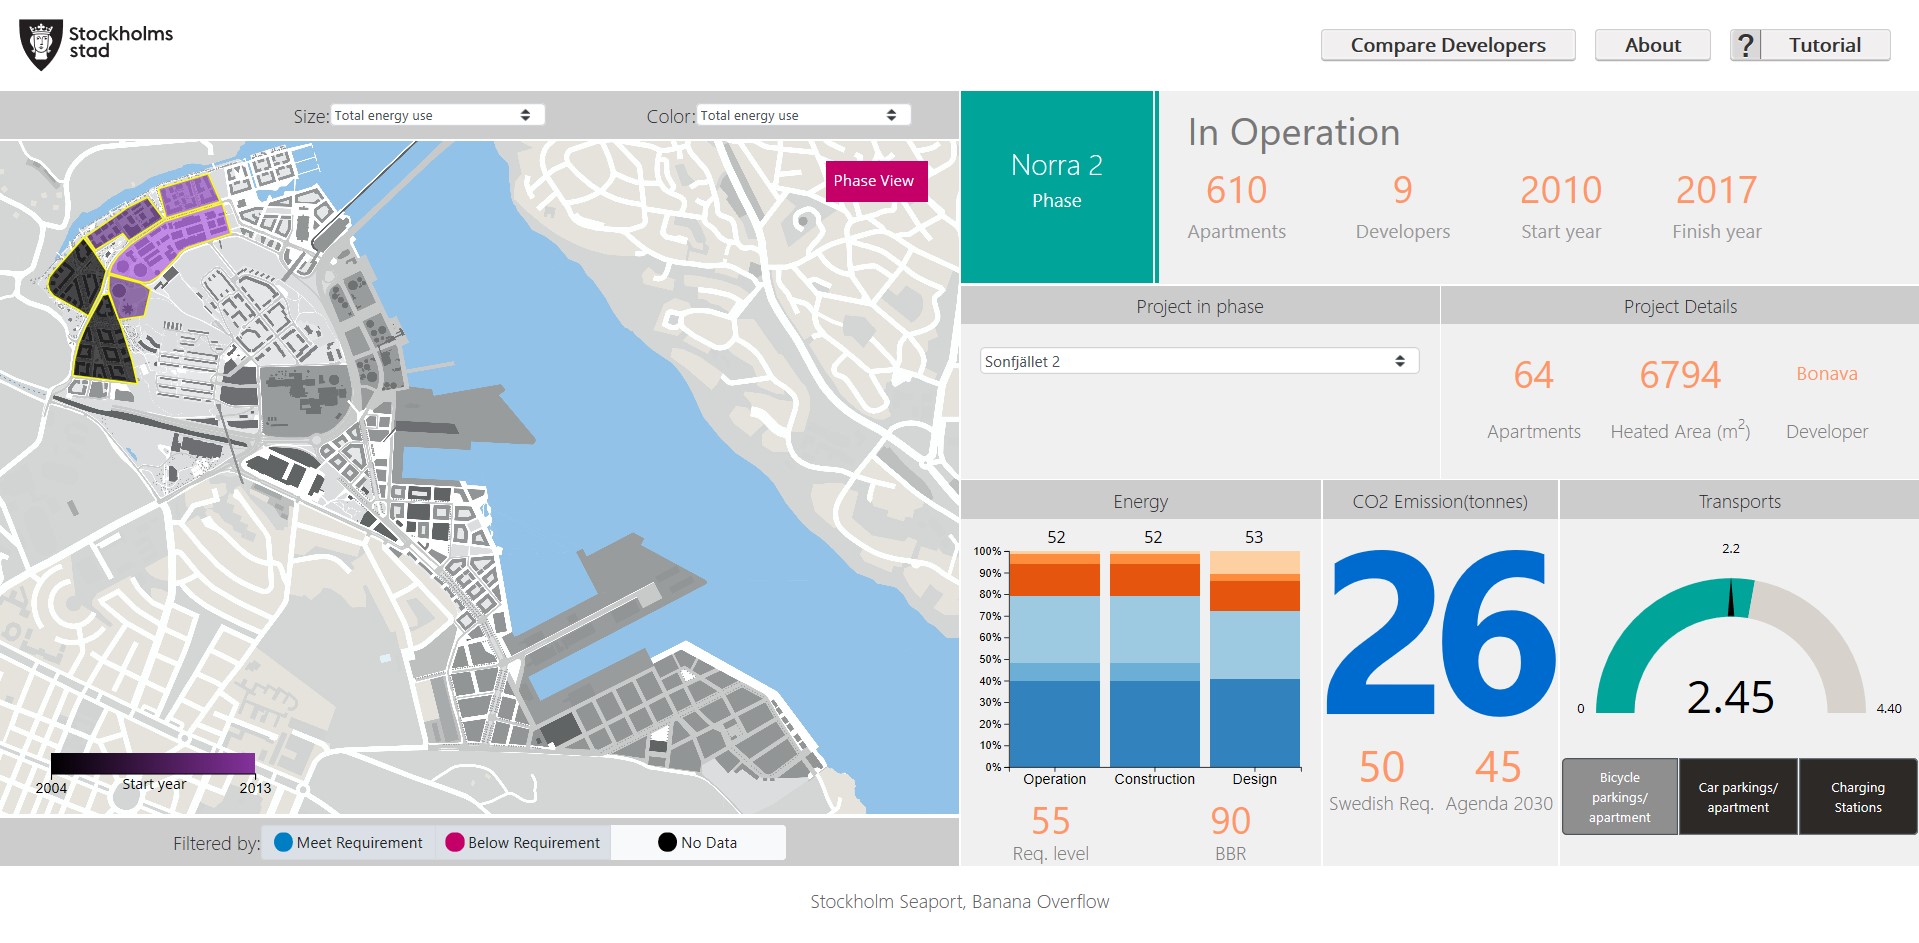
In our project, the targets and requirements of Stockholm Royal Seaport are visualized. The website features an interactive dashboard with an interactive map. The map is color coded according to whether it meets the requirements, and will zoom in on the phase you're currently observing. The website is divided into two different user views for two major groups: politician users and civil servant users. In politician view, politician users can explore the targeting values and national/international requirements based on projects in each phase, and how these value changes at three stages. What’s more, in civil servant view, we allow users to set the weighted criteria for each developers to find out the most qualified one and display its performance in different stages.
Politician View
- Zoom in/out on the map to pay attention to details
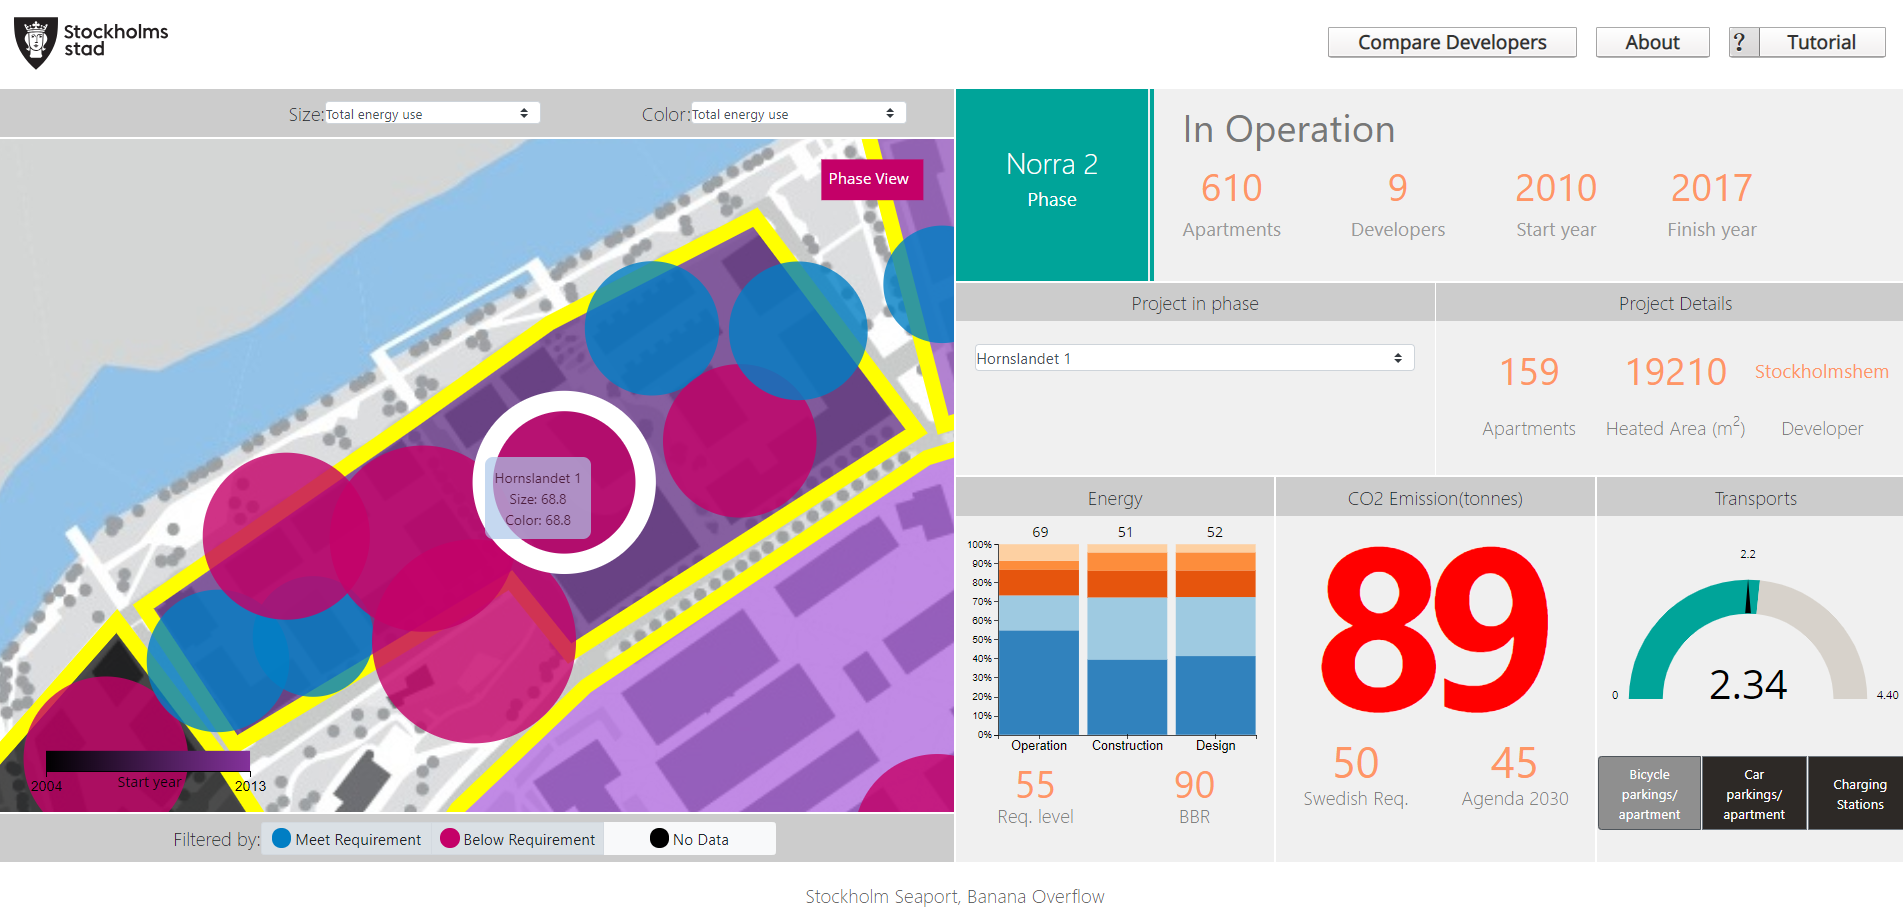
- Hover over projects in specific phase to get more information
- Click on the phase/projects on the map to get more details, including targets (transports, energy use, CO2 emission) and general information (developer, the number of apartments, start year and finish year…)
- Use the drop-down menu to visualize the values of specific projects
- Use the search field to filter out the projects using color bubbles on the map based on colors and sizes
- Use interactive stacked bar charts to visualize the proportion of each energy part by normalizing the total energy
- Use gauge chart to visualize the current value and its requirement
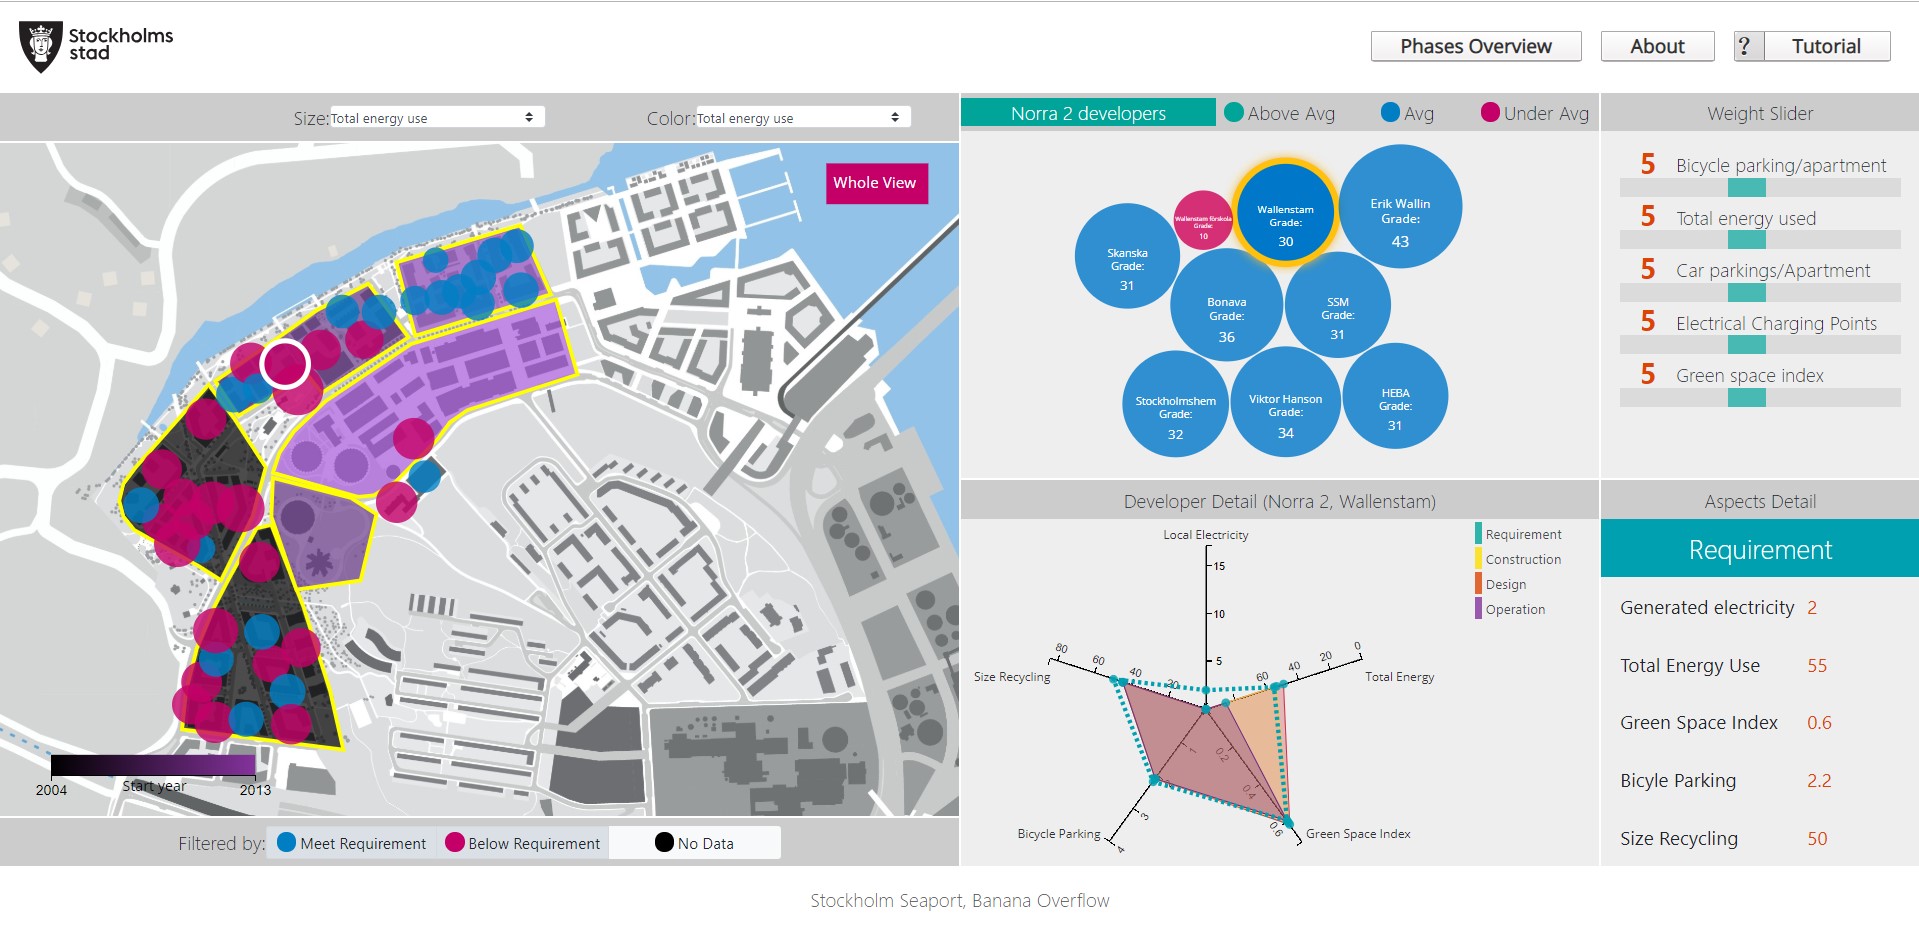
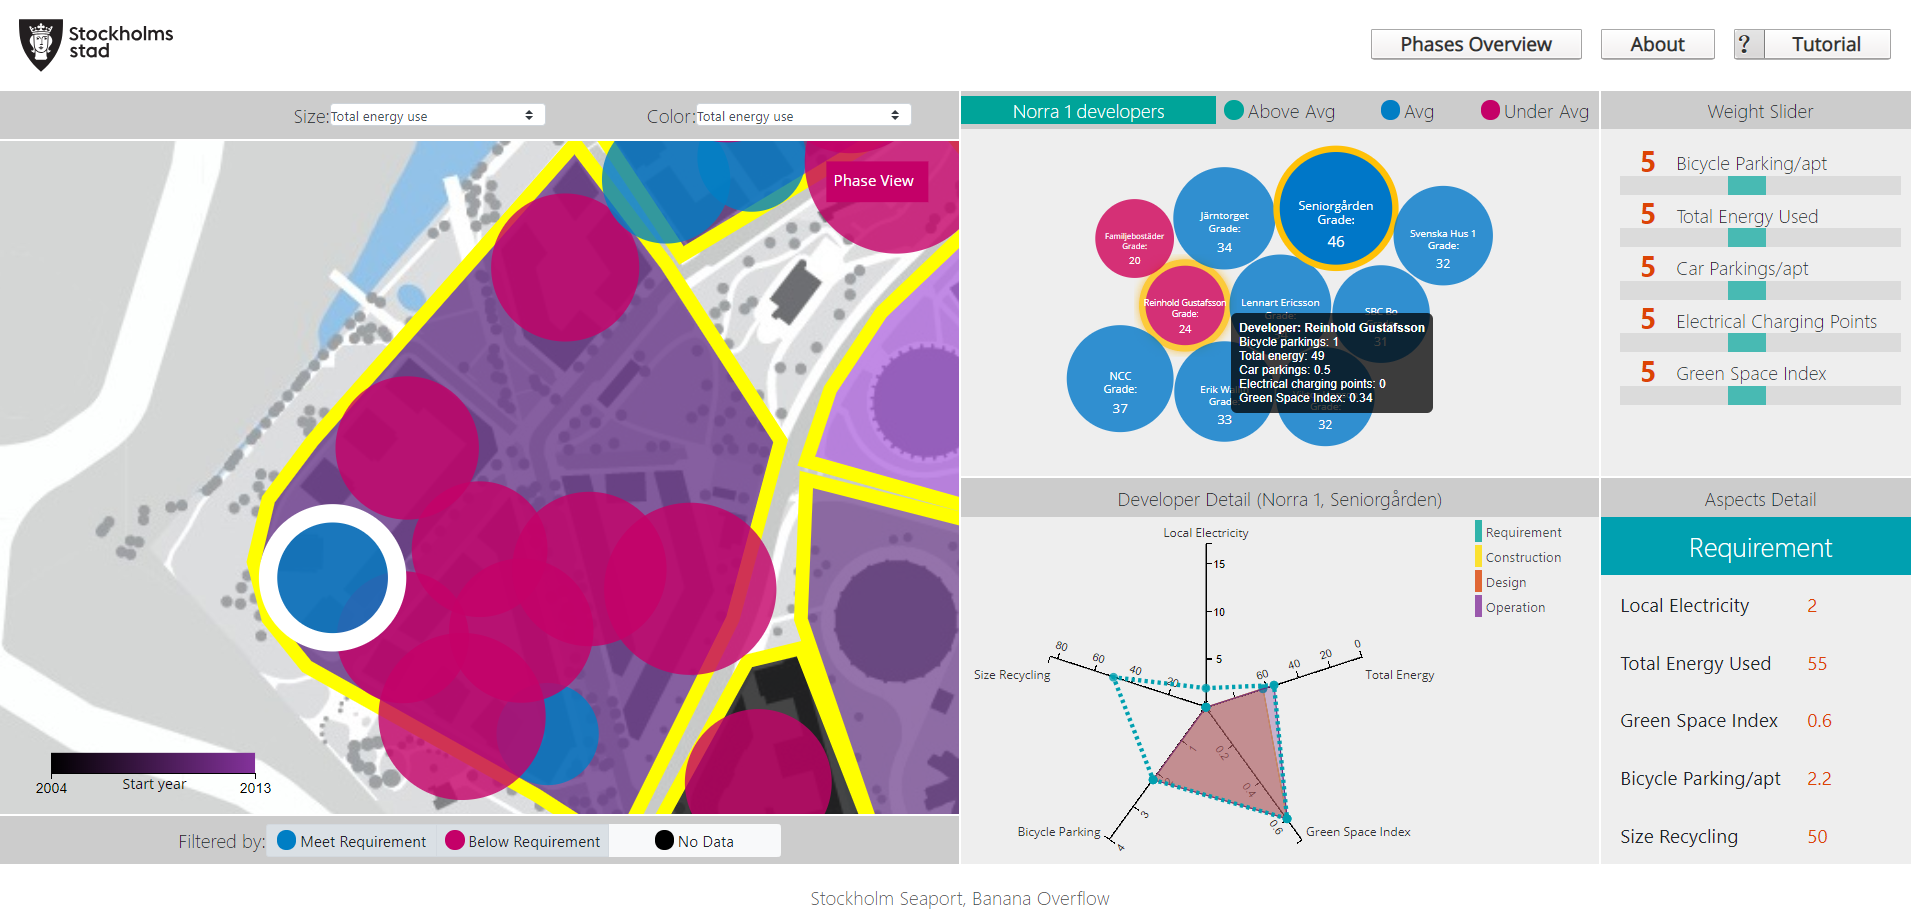
Civil Servant View
- Zoom in/out on the map to pay attention to details
- Hover over projects in specific phase to get more information
- Click on the specific developer bubble to get aspects details based on different stages on radar charts
- Use the size and color of developer bubbles to display the result of weighted criteria
- Use the weight slider to control the size and color of the developer bubbles
- Use the search field to filter out the projects using color bubbles on the map based on colors and sizes
- Use interactive radar chart to visualize the results of five targeting values according to its three stages and the requirements.